The title, of course, is from a West Wing episode a long time ago, where the point is made that how things are visually represented goes a long way to influencing how we think about them.
So, the other day, we talked a little bit about maps, and specifically about cool GIS things that people are doing.And we’ve found some more interesting tools for you, in case you feel like doing mappy things on your own:
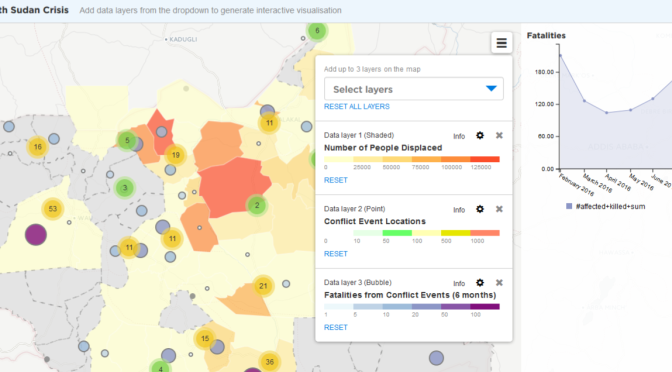
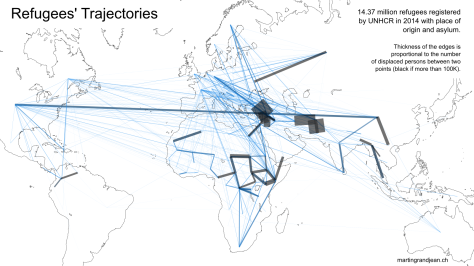
the Humanitarian Data Exchange: Thousands of interesting maps as well as Common Operational Datasets. It has some interactive visualizations you can explore, which is how I made the map in the header in about 35 seconds, on displacement in S Sudan.
Color Brewer 2: To get your style on, and check your color scheme for choropleth maps. There are options such as colorblind-friendly, photocopy-friendly, and print-friendly for all of us who have suffered the agony of producing a graphic illegible to a lot of people.
Map Maker 4 is software for professionals who need to make maps; people like foresters, estate managers, archaeologists, emergency services, ecologists, and many others. It has been designed so that you do not have to be a “GIS” professional to use it.
UX Patterns for Maps: This site presents some design patterns for visualizing and scenarizing content with maps. Each pattern is associated with the problem(s) it solves. The patterns are being spotted and described on GitHub by a set of contributors.
Carto courses: Online Mapping for Beginners In this lesson, you will learn how to work with datasets to create interactive map visualizations. You will explore styling your map, adding multiple datasets, and experimenting with different ways to display your data, including animated maps. You’ll learn how to share your new visualizations with friends, family, and the world. See also: Intermediate map design
One of the (many) challenges in responding to situations of displacement is that of information: knowing what and who is where, identifying resources and needs, and allocating resources. Coordination can be as simple as a 3W (who, what where), or be a complex or interactive tool. There is far, far more that can be said about coordination than can be summarized here. Instead, let’s look at some of the interesting initiatives that have combined maps and technology to map or profile the human geography of displacement.
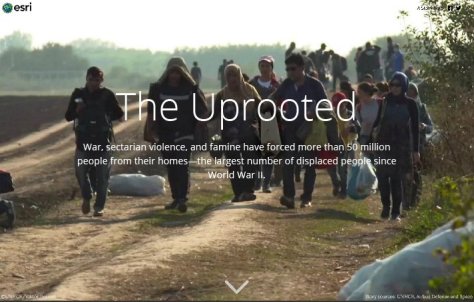
Some interesting story maps and discussions on mapping refugees:
Musings on Maps: Refugee Traffic Scars the Globe’s Surface: “What sort of stories does this simplified map simply omit? The stories of those journeys are interrupted by death, while they are far smaller, of course remain absent: the perilous trajectories of individuals fleeing Syria, Iraq, Africa, Indonesia, Afghanistan and Pakistan however risk not only their lives, but increasingly their legal status as they undertake huge geographic migrations in search of new homes elsewhere, traveling by boat, on foot, or along paths promised by human traffickers. The sleek image, despite its attempted accuracy, shows the intensity of itineraries as embossed on the map as if to disfigure the notion of global unity that runs against the very narrative of global unity implicit in a iconic equidistant azimuthal projection centered on the North Pole which emphasized global harmony as World War II was tried to be forgotten, which as the official flag adopted by the United Nations adopted in October, 1947 promoted an image of global unity:”
Diseases and refugee camps (George Mason University, 2012) – “Our initial focus is on the the Dadaab refugee camps which are located in Kenya, approximately 100 kilometers from the Somali border. The camps themselves are homes to roughly 500,000 people, with nearly 99% of the population coming from Somalia. Within the camps the mortality rate is ~ 0.44/10,000 per day with diseases such as cholera and measles being among the causes of death.”
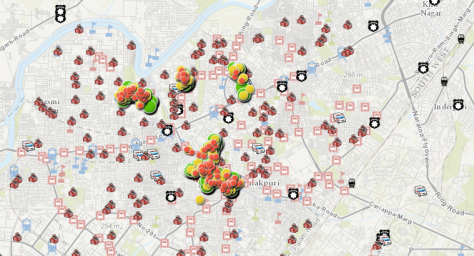
Livelihood, security, and access to services among urban refugees in Delhi (JIPS) – The goal of the Stanford students` research project was to add spatial analysis capabilities in order to better identify and understand geographic patterns related to refugee security. A Livelihood Index score was calculated for each household, based on responses covering the four key components of livelihoods. This enabled to carry out a spatial analysis of the distribution of households with high living standards (scoring high in the Livelihood Index) and low living standards (scoring low) with respect to one another, ethnicity, and proximity to public services. Results from the spatial analysis suggested that proximity to services did not significantly correlate with higher living standard, suggesting that physical distance to services may not be the most important barrier for urban refugees. Finances, lack of mobility, or discrimination may play more significant roles in living standards. See the full, interactive study here!
Livelihoods, access to services among urban refugees in Delhi – JIPS
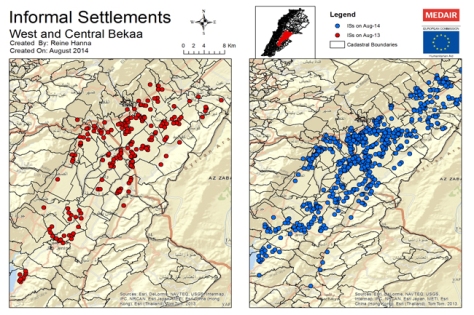
Earth observation and GIS to support humanitarian operations in refugee/IDP camps – “Since 2011 we are providing Earth observation-based information services to Médecins Sans Frontières (MSF) on demand. A service on population monitoring has already reached an operational stage. Thereby indicators on population are derived by automated dwelling extraction from (multi-temporal) very high resolution (VHR) satellite imagery. Based on such information, further added-value products are provided to analyse internal camp structure or camp evolution. Two additional services to support groundwater extraction and assess the impact of the camps on the environment are currently under development. So far twenty-five sites in nine countries have been analysed and more than a hundred maps were provided to MSF and other humanitarian organisations.”
Satellites Guide Aid Workers Sinking Water Wells For African Refugees (European Space Agency, 2004): Caring for more than 180,000 Sudanese refugees gathered in the desert landscape of eastern Chad, the United Nations High Commissioner for Refugees has begun using satellite data to identify hidden water resources and site new camps.
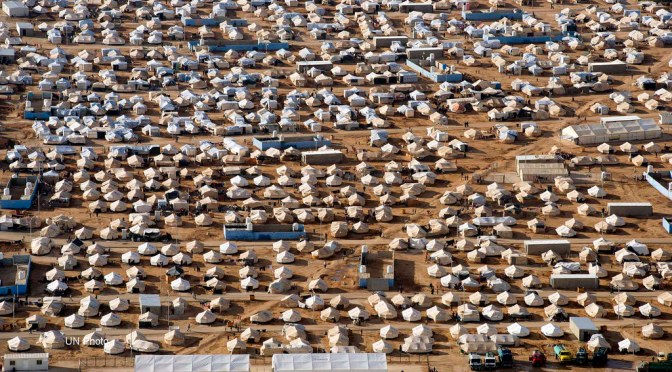
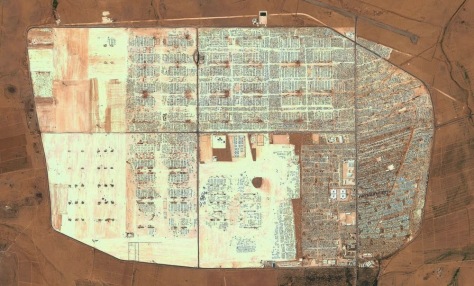
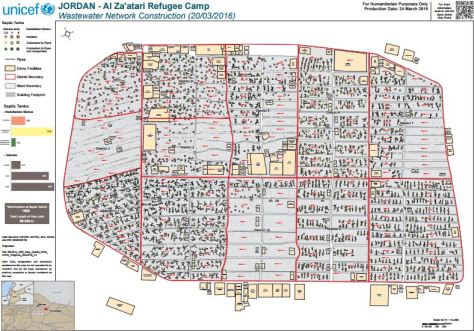
Za’atri refugee camp, Jordan
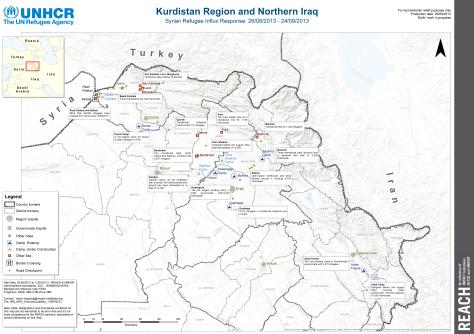
Syria Refugee Sites – “Data as of June 11, 2015. The “Syria Refugee Sites” dataset contains verified data about the geographic location (point geometry), name, and operational status of refugee sites hosting Syrian refugees in Turkey, Jordan, and Iraq. Only refugee sites operated by the United Nations High Commissioner for Refugees (UNHCR) or the Government of Turkey are included.”
Using GIS as a planning and coordination tool in refugee camps in South Sudan – “The South Sudan refugee crisis has suffered from substantial information gaps, largely stemming from a lack of coordinated approaches to data collection and inadequate resources to operationalise such a data collection effort. In particular, shortcomings in the availability and reliability of data about patterns of refugee flows over the border, settlement area characteristics and overall social organisation have limited the speed and effectiveness of the humanitarian response. To address these gaps, REACH, in partnership with UNHCR, developed a simple methodology aimed at bringing together data from reliable sources and representing it in both text and geospatial formats, such as static and interactive webmaps.”
Informing Humanitarian Action with GIS in Al-Za’atari Camp – “Information about Al Za’atari collected by REACH is available on the open geo-portal Open Street Map. IS officers adjust data in to suit OSM by using JOSM and Mercaator software, a mapping platform commonly used by the digital humanitarians in emergency environments. Information is shared in a free map that can be viewed online or downloaded, although some information is protected due to its sensitive nature. Using OSM means that spatial data can be immediately available and therefore more effective in crisis situations when there is little time to construct more complex software. As part of its commitment to improve information management in emergencies, REACH has created an OSM wiki-page to explain how the data is structured and adjusted to the software so other humanitarian organisations can replicate the method elsewhere around the world. The REACH team in the Kurdistan Region of Iraq (KRI) is now following the Al Za’atari model for refugee camp mapping.”
Using GIS technology to map shelter allocation in Azraq refugee camp (UNHCR Innovation) – “to allocate shelters, staff just had to navigate through a map of the camp to see which shelters had already been allocated, which ones were available, and how many people were living inside. Later on, the program would show additional data, such as whether the shelter had been damaged, or if it was occupied informally by another family. Staff only had to click on the desired shelter to allocate it, and the data would then feed directly into the progress file. What’s more, it only took an impressive 20 seconds to find the right key among 10,000.”
GIS for Good: Siting refugee camps in Uganda – “The first objective of the project was to develop two separate scenarios for refugee campsite selection. Scenario 1: Existing Community Infrastructure, was designed such that the selection of sites would assume that refugees would be reliant on the community infrastructure that already exists. This would provide refugees an opportunity to integrate with local communities to a certain extent, and put less pressure on UNHCR to develop the infrastructure for new camps in rapid crisis situations. Scenario 2: New Community Infrastructure, was designed under the assumption that UNHCR would be able to provide infrastructure to new camps. Although both models aspire to a level of community integration, this model would be undertaken under the hope that the presence of UNHCR and thus, refugees, would actually benefit communities that had previously suffered from poor access to certain resources. These camps might prove a bit more difficult to develop, but the hope is that the positive effects of a camp would benefit the communities for a long time to come.”
What Makes a Camp Safe? The Protection of children from Abduction in Internally Displaced Persons and Refugee Camps– “The study is one of the first initiatives to generate a database of IDP and refugee camp attacks for analysis and policymaking purposes. The researchers also used geographic information systems (GIS) software to produce a series of maps that chart migration trends, camp attacks, and the abduction of children. A major advantage of GIS mapping is the ability to track the movement of IDP and refugee populations over time; this will allow Pitt researchers to continue to track population movements to determine whether migratory populations are at greater risk than those in permanent, stationary camps.”
Joint IDP Profiling Service, an inter-agency service based in Geneva, to provide technical support to government, humanitarian and development actors seeking to improve their information about internally displaced populations